 eAtlas Data Catalogue
ESRI Shapefile
Type of resources
Topics
Keywords
Contact for the resource
Provided by
Years
Formats
Representation types
status
-
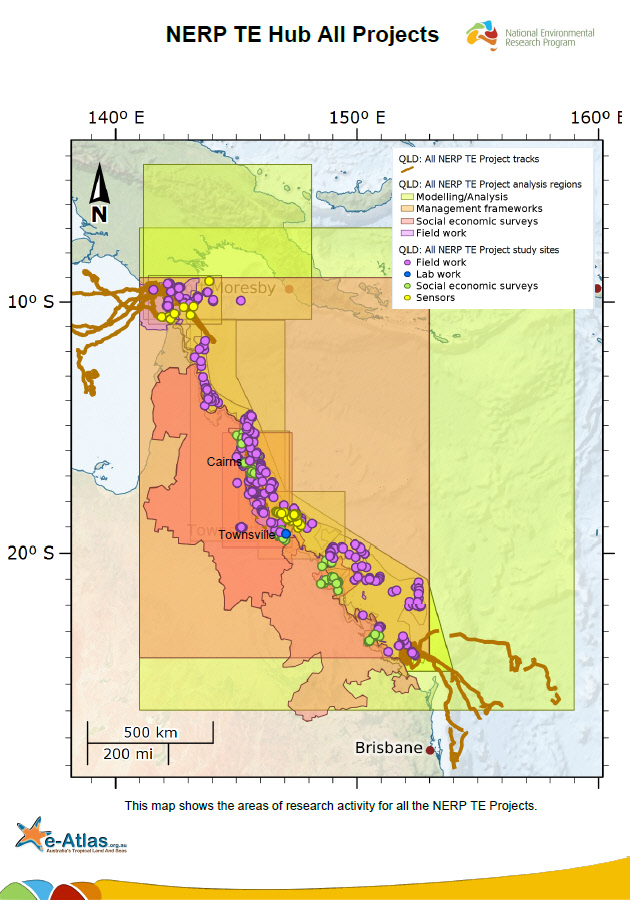
This dataset describes the areas of research activities for the 38 National Environmental Research Program Tropical Ecosystem (NERP TE) Hub projects. It represents the areas that have field work being conducted, where measurements have been taken and where modelling or analysis is being done. It consists of three master shapefiles (points, lines and polygons) that capture the regions that are being studied by all these projects. These master shapefiles are also made available split by project. The data contained in this dataset was compiled from June 2013 submissions from each of the NERP TE projects asking them to describe their areas being researched. They submitted this information in a range of formats including spreadsheet tables for site information (points) and bounding boxes, KMLs for study areas, transects and animal tracks (lines and polygons), raster files and for some simply a description of the region. All of these formats were converted, digitised or drawn into three shapefiles: one for points, one for polygons and one for lines. Each feature was given a description of the type of research or measurement that was being under taken at that location and a link to the associated project pages. Features were also classified to roughly group the type of research work being done at each location. This data was originally intended to be part of the creation of detailed spatial data for the creation of metadata records describing each of the projects. It was also used for creating maps for each project. These maps are available for download and are available as WMS layers from the eAtlas. The polygon features from the various projects overlap significantly and thus many boundaries are hidden with default styling. The order of the features within the shapefile has been chosen so that at least some part of each polygon is visible when all polygons are shown. This dataset is not a complete representation of the work being done by the NERP TE projects as it was collected only 2 years into a 3.5 year program. In addition to this some project have chosen to protect the exact location of sensitive sites and so have only provided coarse spatial information about the project. This dataset will be updated periodically as more NERP TE data becomes available.
-
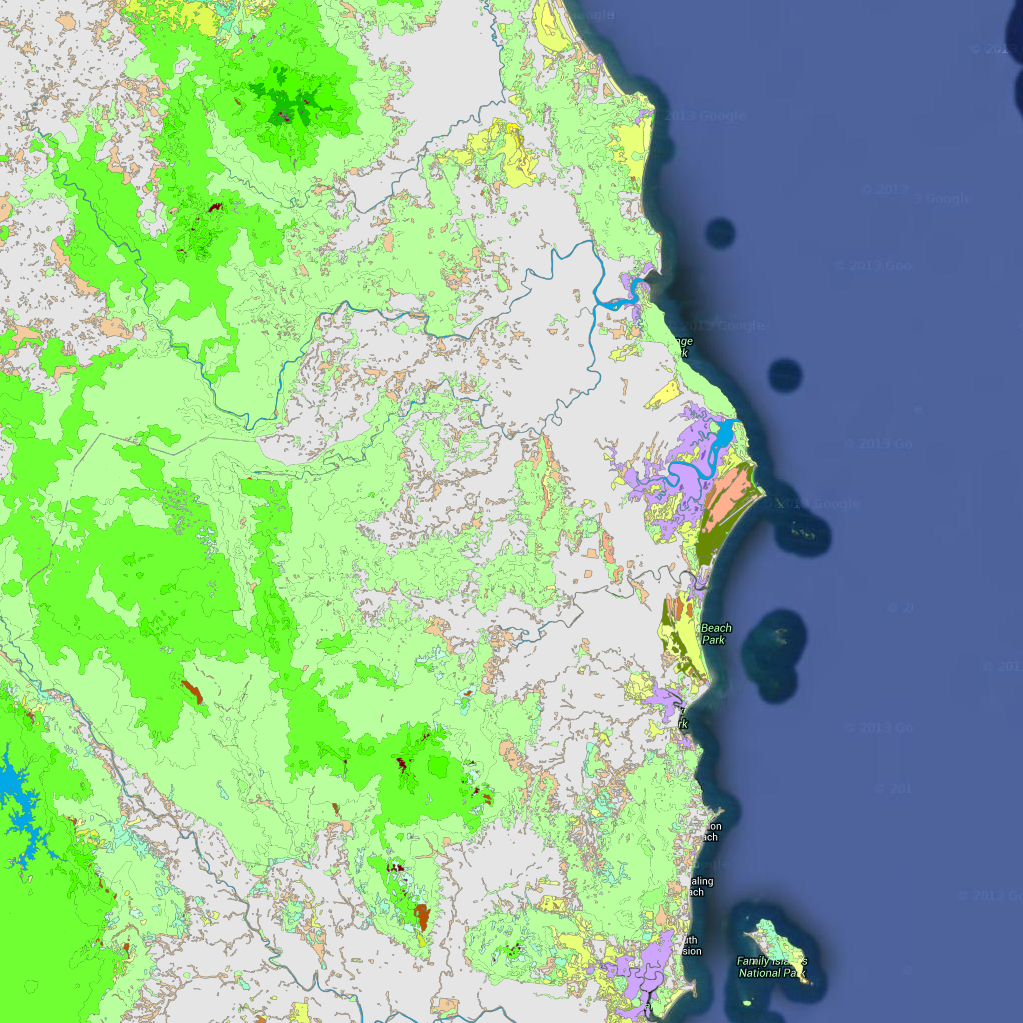
This dataset contains polygons depicting vegetation communities of the Wet Tropics Bioregion. Over 250 vegetation types are described using structural and floristic characteristics, and the vegetation communities have been classified using a logical, hierarchical framework. At a broad level, the vegetation includes the rainforests, forests and woodlands, sclerophyll rainforests, shrublands and heathlands, herblands and mangrove communities distributed throughout the bioregion. The dataset is derived from 1:25 000 stereo aerial photography. J.P. Stanton and D.J. Stanton delineated vegetation and geology types by manually interpreting and drawing polygons directly onto the aerial photography. The vegetation of the Wet Tropics Bioregion GIS dataset is also available to or those with ArcGIS capacity. Contact wettropics@wtma.qld.gov.au for more information. Attributes The vegetation has been classified into 5 levels, each of increasing level of detail. The following is the list of unique values for the first three levels. For the complete list of all 5 levels please refer to the 'Vegetation Levels 1 to 5 classification list' document. Level_1: * Vegetated, * Unvegetated Level_2: * Sclerophyll forests and woodlands, * Cleared, unvegetated or non-native * Rainforests * Mangroves * Non-woody vegetation * Shrublands and heathlands * Vegetation complexes and mosaics * Sclerophyll and sclerophyll rainforest transitions Level_3: * Eucalyptus forests and woodlands * Melaleuca forests and woodlands * Water bodies * Mesophyll rainforests * Mangrove forests * Mangrove grasslands and herblands * Rural, agricultural or urban areas * Grasslands * Shrublands and heathlands * Coastal beach complexes * Riparian complexes * Naturally unvegetated * Closed Acacia forests * Closed Eucalyptus forests * Acacia forests and woodlands * Microphyll thickets * Notophyll rainforests * Secondary successional complexes * Casuarina forests and woodlands * Sedgelands * Rock pavement and coastal headland complexes * Lophostemon forests and woodlands * Fern complexes * Microphyll rainforests * Palm-leaf rainforests * Wetland complexes * Syncarpia forests and woodlands * Notophyll thickets * Closed Lophostemon forests Positional accuracy The positional accuracy of the mapped vegetation polygons is ±12 metres from the true position as depicted on the Australian 1:50 000 Topographic Survey Map Series R733. Horizontal accuracy is estimated at 90% of well-defined detail within ±50 metres of true position. Attribute accuracy Attribute accuracy is estimated at 95%. Citation Wet Tropics Management Authority (2009). Vegetation Mapping of the Wet Tropics Bioregion of Queensland. Wet Tropics Management Authority, Cairns. Acknowledgements The expert assistance and advice of James Cook University and the Queensland Herbarium is gratefully acknowledged. /Base data/Data reproduced with permission of Wet Tropics Management Authority/ This metadata was prepared for the eAtlas and is not authoritative. Please contact the Wet Tropics Management Authority for an authoritative record.
-
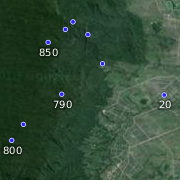
This dataset contains point features depicting spot heights for the Wet Tropics Bioregion. The SpotHeight-250K dataset was sourced primarily from the 1:250 000 scale National Topographic Map Series (NTMS) and the Royal Australian Survey Corps Joint Operation Graphics (JOG) map reproduction material (repromat). This dataset consists of a 25 MB shapefile containing 134,007 point features. *Accuracy* Horizontal accuracy is at 90% of well-defined detail within +/- 125m of true position. The dataset has an attribute accuracy of 100%. Data reproduced with permission of Wet Tropics Management Authority This metadata was prepared for the eAtlas and is not authoritative. Please contact the Wet Tropics Management Authority for an authoritative record.
-
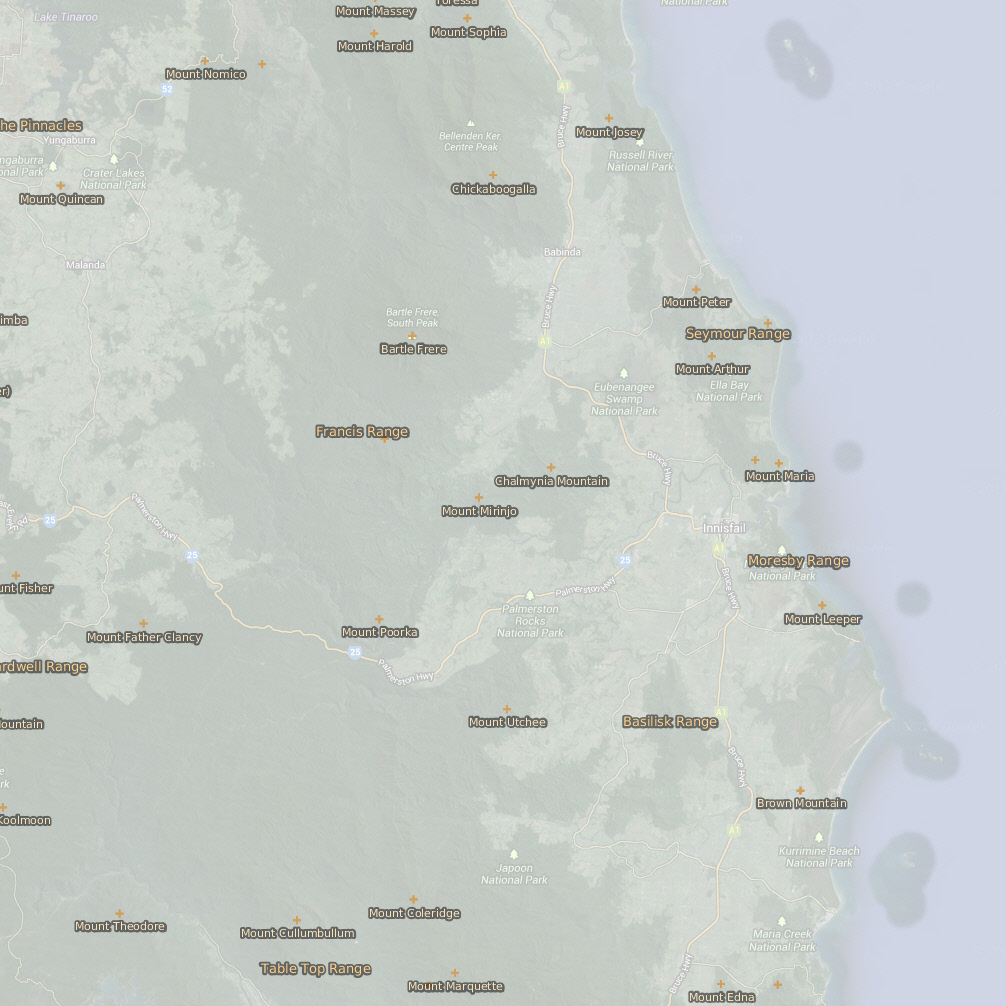
This dataset contains point features depicting mountains, peaks, mountain ranges and hills and their names. Ranges are located with a point or series of points in the approximate vicinity of the feature. Mountain data originated from 1:250,000 scale AUSLIG supplied topographic data (repromats). Corrections were made to locate the points accurately to the 1:100,000 scale National Topographic Map Series. Georeferenced Topographic Maps are dated 1966. This dataset consists of a 90 KB point shapefile containing 344 features. 95% of points within the Mountains coverage were located to the 1:100,000 scale Topographic maps Series. Some smaller hills, mountains and ranges shown on the 1:100,000 scale Topographic map Series, not in the original source data, have not been included in this dataset. 90% of the points are within +/- 50 metres of true position. Data reproduced with permission of Wet Tropics Management Authority This metadata was prepared for the eAtlas and is not authoritative. Please contact the Wet Tropics Management Authority for an authoritative record.